


Introduction
Force Motors, a prominent name in India’s commercial vehicle and component manufacturing industry, has captured investor attention recently due to strong quarterly performance and rising investor interest. Force Motors share analysis aims to demystify both its fundamentals and technicals for you.
As of early September 2025, Force Motors is trading around ₹17,725 per share with a market cap of ~₹23,350–23,840 crore. This surge stems from a ~55% jump in Q1 (April–June 2025) profit, fueled by heightened demand for its popular ‘Traveller’ multi-seater vans and engine contracts for premium brands.
This Force Motors share analysis introduces beginners to the company, provides detailed fundamental and technical insights, and assesses whether now’s the right time to invest—based on current data and chart trends.
Table of Contents
Company Overview
Founded in 1958 (formerly Bajaj Tempo until 2005), Force Motors is headquartered in Pune and has grown into India’s largest van manufacturer. Vertical integration—making its own components, engines, and assembly—enables cost control and supply chain resilience. Its portfolio includes Traveller, Gurkha, Urbania, Citiline, Trax, Monobus, ambulances, and tractors.
Key business segments:
- Vehicle manufacturing: light commercial vehicles (LCVs), multi-utility vehicles (MUVs), passenger carriers, school buses, ambulances.
- Component manufacturing: engines, axles, die-cast parts.
- Contract manufacturing: engines/transmissions for BMW and Mercedes-Benz.
- Export markets: Middle East, Asia, Latin America, Africa, SAARC, ASEAN as well as Europe.
Recent development: Q1 FY2026 (Apr–Jun 2025) saw 22% YoY revenue growth driven by vans like Traveller.
Fundamental Analysis
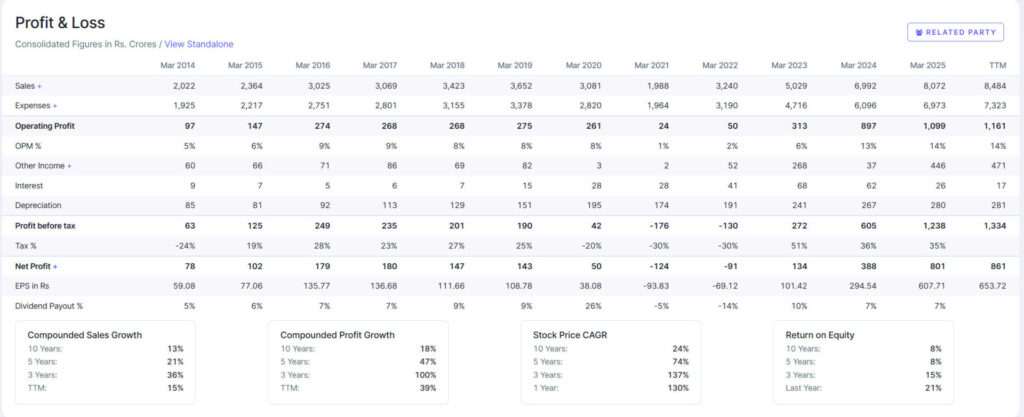
Financial Performance Table
| Metric | Mar 2025 (TTM / FY) |
|---|---|
| Revenue (\₹ cr) | ~₹8,484 cr (TTM) |
| Net Profit (\₹ cr) | ~₹861 cr (TTM) |
| EPS (\₹) | ~₹653.7 (TTM) |
| ROE | ~20.8% |
| ROCE | ~30% (Screener) / ~25% |
| P/E Ratio (TTM) | ~27–30x |
| P/B Ratio | ~7.9× |
| Debt-to-Equity | ~0.01× – nearly debt-free |
Recent Quarterly & Annual Results
- Q1 FY2026 (Apr–Jun 2025): Revenue ~₹2,297 cr (+22% YoY) and profit ~₹185 cr (+~55% YoY).
- Annual FY 2025: Robust EPS and margins, improving profitability metrics and return ratios.
Key Strengths
- Strong profitability: High ROCE/ROE, growing margins.
- Debt-free balance sheet: Debt/Eq ~0.01.
- High demand for flagship products like the Traveller, anchored by institutional contracts and exports.
- Diversified revenue via components and engine contracts with BMW/Mercedes.
Risks & Challenges
- Valuation premium: High P/E (~27–30×) and P/B (~8×) compared to peers.
- Cyclicality: CV business sensitive to economic cycles and infrastructure demand.
- Regulatory risks: Auto emissions standards, tax structure, EV transition.
- Competition: From major auto players in LCV/MUV and commercial segments.
Valuation Estimate
Based on strong fundamentals but lofty multiples, a fair P/E range could be 20–25×. Applying 22× P/E to 2025 EPS (~₹654) yields a fair value of ₹17,700 already reflects growth optimism.
Technical Analysis
Current Price Action
- CMP: ~₹17,725 (as of Sept 5, 2025).
- 52-week range: ₹6,125 – ₹21,990.
Chart Pattern Analysis
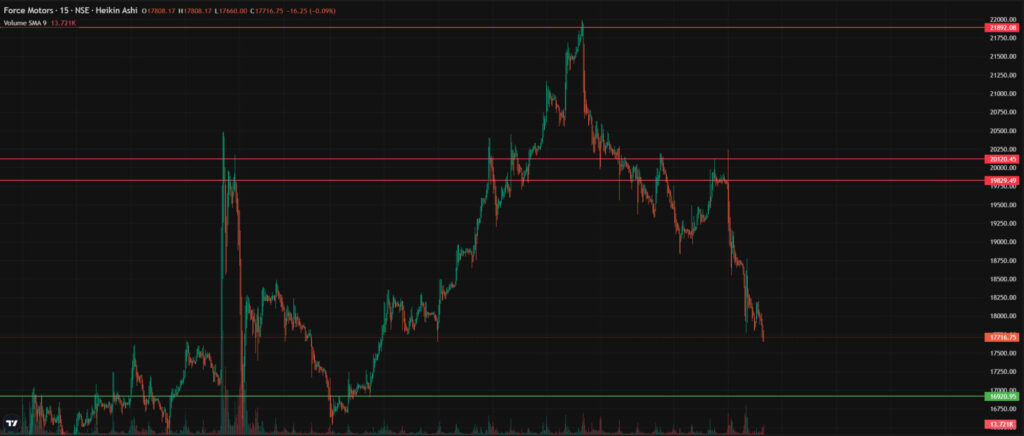
- Support levels: Around ₹17,000 (recent low).
- Resistance levels: ₹19,800–20,000 and ₹21,990 (52-week high).
Trend Analysis
- Strong uptrend over past year with >120% return.
- Recent pullback from highs indicates short-term consolidation.
Key Technical Indicators (StockAnalysis data):
- 50-DMA: ₹17,632
- 200-DMA: ₹10,698
- RSI: ~44.8 – neutral to slightly oversold
- Beta: ~0.74 – less volatile than market.
Volume trend: Recent dip in price came with moderate volume—suggests controlled correction.
Technical Levels Table
| Level | Value (₹) |
|---|---|
| Support | ~17,000 |
| 50-DMA | ~17,632 |
| Resistance 1 | ~19,800–20,000 |
| All-time High | ~21,990 |
Future Outlook & Price Targets
Price Targets
- Short-term: Recovery toward ₹19,800–20,000 if earnings momentum continues and technicals stabilize.
- Long-term (12-18 months): Fair value range ₹14,400–₹16,000 based on fundamentals; optimism may push it toward ₹20,000+ if growth persists.
Growth Drivers
- Continued demand for Traveller vans, especially for institutional use (schools, hospitals).
- Engine contracts with global OEMs.
- Potential export growth and aftermarket volumes.
- Segment diversification into agriculture and special vehicles.
Risks to Outlook
- Auto sector slowdown, macroeconomic headwinds.
- Regulatory tightening or rising competition.
Should You Buy Force Motors Stock Now?
From a fundamental standpoint, Force Motors shows robust profitability, rising EPS, almost zero debt, and strong growth via both product and contract streams. That bodes well for long-term investors.
On the technical side, the stock remains in an uptrend, supported by its 50-DMA. RSI suggests it’s not overbought. Key resistance lies ahead at ₹19,800–20,000.
For short-term traders, the entry zone could be around ₹17,000–17,600, targeting ₹19,800 with a stop below support. For long-term investors, the core price range of ₹14,400–16,000 based on fundamentals offers a margin of safety, though current levels reflect premium valuation that expects sustained growth.
Summary view:
- Strong fundamentals: Great.
- Valuation: expensive.
- Technical trend: consolidating — watch support.
Thus, cautious accumulation near support could suit long-term investors. Short-term traders may prefer waiting for a breakout above ₹19,800 before entering.
Conclusion
This Force Motors share analysis highlights a fundamentally solid company riding strong demand and healthy earnings, justifying vigilance even in the face of premium valuation. Technically, the stock shows resilience but faces resistance around ₹20,000. A balanced approach—buying near support for long-term efforts or awaiting confirmation for short-term traders—makes sense.
Remember: Always do your own research before investing.
FAQs
What is the Force Motors share price forecast?
Analysts haven’t provided official targets. Based on fundamentals, fair value lies around ₹14,400–₹16,000; technical breakout could take it toward ₹20,000.
Is Force Motors a good buy now?
It’s fundamentally strong but costly. Consider buying near ₹17k support for long-term hold; short-term traders may wait for move above resistance (~₹19,800). (Don’t consider this as Buy/Sell advice make your own research before making a decision)
What’s Force Motors’ dividend history?
Latest dividend per share: ₹40 (yield ~0.2%). Dividend payouts are modest but have risen.
What are technical analysis basics for this stock?
Watch support (₹17k), resistance (₹19.8k), 50/200 DMA, RSI (~44), and volume. Use them to gauge entry/exit levels.
What are its future growth prospects?
Growth hinges on demand for MUVs like Traveller, engine contracts, exports, and diversification across segments & markets.
Disclaimer: This article is for informational purposes only and does not constitute investment advice. Please consult a financial advisor before making any investment decisions.